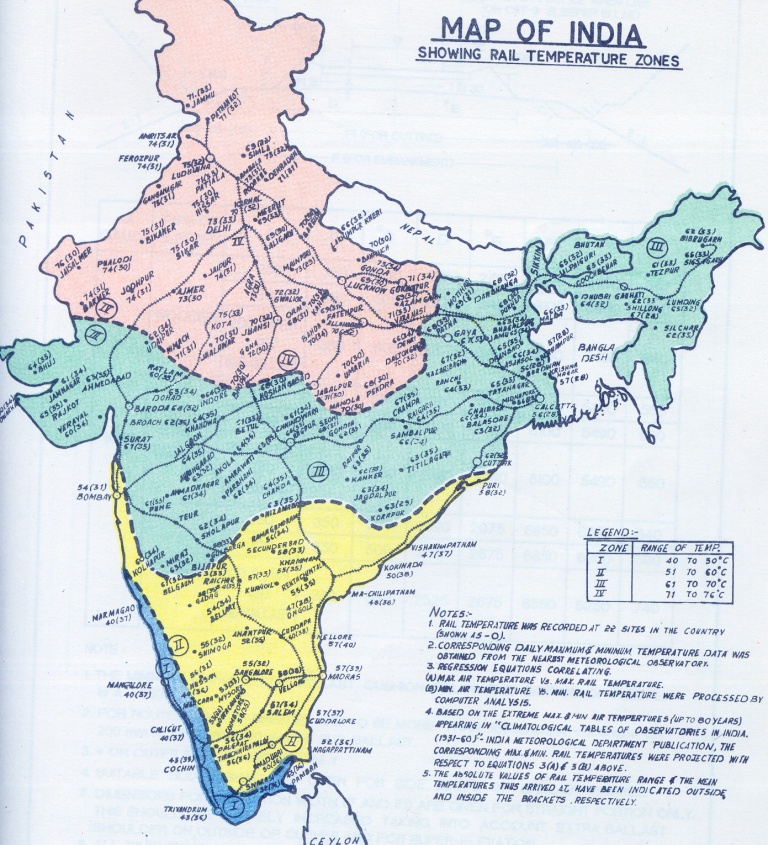
Rail Temperature Zone Map
This IR map shows the temperature zones into which the railway network is divided for purposes of permanent way maintenance. The track tolerances, limiting values, maintenance schedules, etc., vary across these zones.
In this map, the figures shown against each station name are the range of rail temperatures (maximum - minimum) shown outside the parentheses; and the mean temperature for the location shown within parentheses. Thus, the maximum temperature can be obtained by adding half the range to the mean and the minimum temperature can be obtained similarly by subtracting half the range from the mean. The temperatures for the maximum and minimum are 50-year extrema and hence represent a rather more severe variation of temperature than is normally encountered.
Map provided by Rajeev Shrivastava.